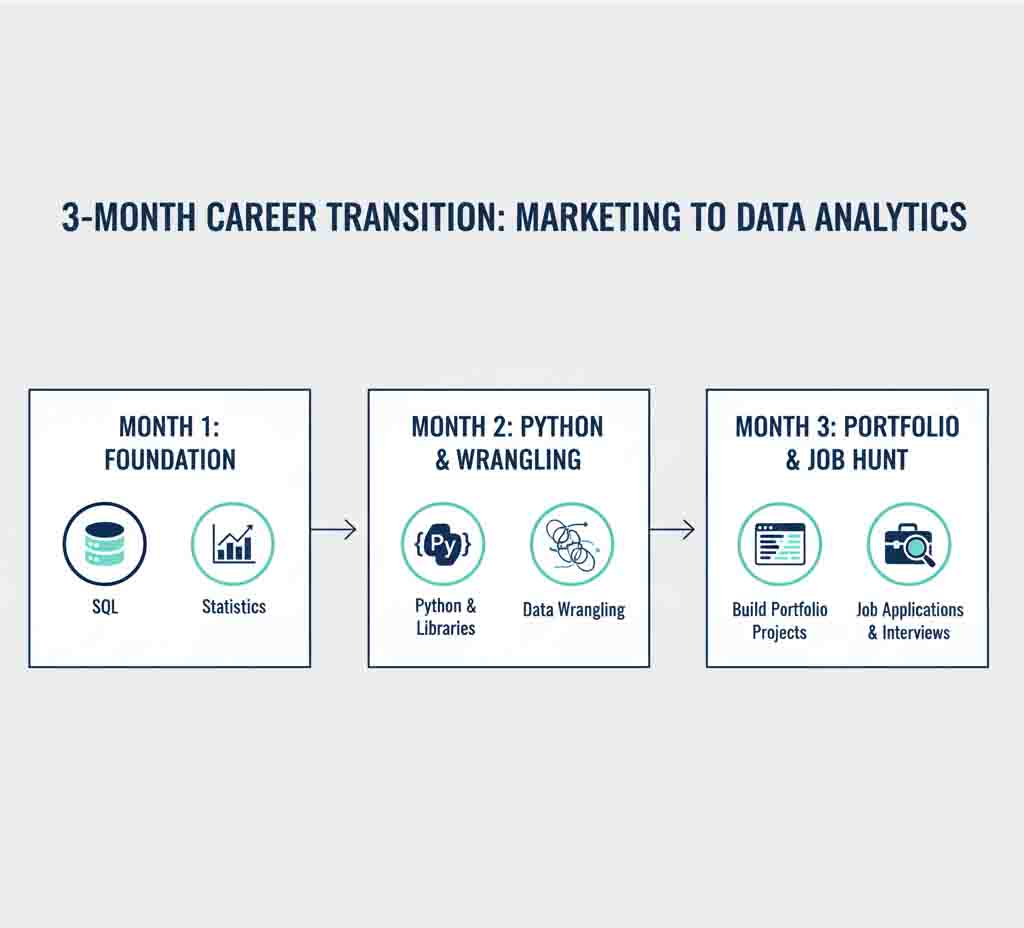
Your 3-Month “Career Pivot” Blueprint
Phase 1: Month 1 – Foundation & The Data Mindset (Weeks 1-4)
Goal: Solidify your foundational knowledge and master the most critical tool: SQL.
Week 1-2: SQL Fundamentals
Learning Goal: Become proficient in writing SELECT statements, WHERE filters, JOINs (INNER, LEFT), and aggregate functions (GROUP BY, COUNT, SUM, AVG).
Resources: Interactive Tutorials: Codecademy’s “Learn SQL” course; Practice Platform: DataCamp or LeetCode for hands-on exercises.
Week 3-4: Introduction to Statistics & Excel for Analysis
Learning Goal: Understand descriptive statistics (mean, median, mode, standard deviation) and master advanced Excel (PivotTables, VLOOKUP, basic charts).
Resources: Video Lectures: Khan Academy’s Statistics course; Practice: Analyze a sales dataset from your previous marketing role using PivotTables.
Phase 2: Month 2 – Python & Data Wrangling (Weeks 5-8)
Goal: Learn the programming language of data and how to clean and manipulate real-world data.
Week 5-6: Python for Data Analysis
Learning Goal: Master the basics of Python and the essential libraries: Pandas for data manipulation and NumPy for numerical operations.
Resources: Book/Guide: “Python for Data Analysis” by Wes McKinney; Online Course: Coursera’s “Python for Everybody” specialization.
Week 7-8: Data Cleaning & Visualization (Matplotlib/Seaborn)
Learning Goal: Learn to handle missing data, reshape datasets, and create clear, impactful visualizations with Python.
Resources: Practice Platform: Work with messy datasets from Kaggle; Tutorials: Seaborn and Matplotlib official documentation and tutorials.
Phase 3: Month 3 – Portfolio & The Job Hunt (Weeks 9-12)
Goal: Build a compelling project portfolio and prepare for the job market.
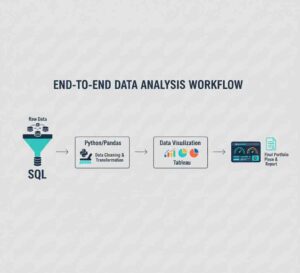
Week 9-10: Build Your First End-to-End Project
Learning Goal: Apply all your skills to a single project. Example: “An Analysis of Digital Marketing Campaign Performance & Customer Segmentation.”
Action: Use SQL to extract data, Python/Pandas to clean and analyze it, and create a dashboard in Tableau/Power BI. Publish everything on GitHub.
Week 11: Master a BI Tool (Tableau or Power BI)
Learning Goal: Create interactive and visually appealing dashboards. This is a highly sought-after skill.
Resources: Tableau Public (free) and their training videos; Microsoft Learn for Power BI modules.
Week 12: Polish Your Resume & Network
Learning Goal: Translate your marketing experience into data-driven achievements. Use action verbs like “analyzed,” “modeled,” “optimized.”
Action:
-
-
-
Create a “Data Analyst” resume highlighting your new projects and technical skills.
-
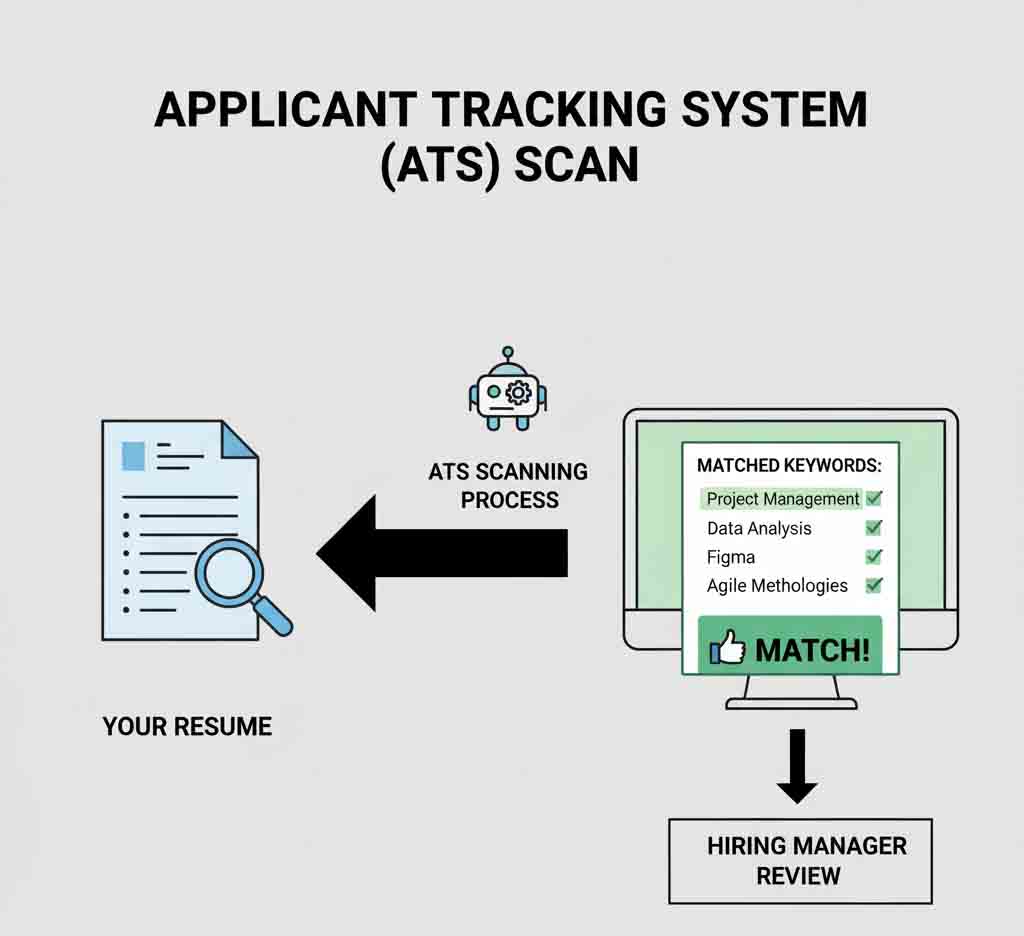
Optimize your LinkedIn profile with keywords from data analyst job descriptions.
-
Start connecting with data professionals and recruiters on LinkedIn. Prepare for behavioral interviews using the STAR (Situation, Task, Action, Result) method.
-
-